Anomaly Detection
Anomaly detection identifies data points that deviate from expected behavior, signaling potential issues like unusual activity. It uncovers hidden problems and provides insights into system performance. This feature acts as an early warning system, enabling quick responses to threats and preventing damage. It also improves efficiency by detecting process inefficiencies, reducing risks and supporting better decision-making through timely insights.
Anomalies are detected for all the runs and notifications are sent to the concerned users.
Process of Anomaly Detection
Receiving Anomaly Notifications
-
Step 1: Set Up Email Digest: You need to create an email digest to receive notifications. The digest is specific to each account.
-
Step 2: Receive Notifications: The email digest sends notifications based on the time set in the digest.
-
Step 3: View Anomalies: The email will include a summary of detected anomalies and a direct link to the affected run.
-
Step 4: Review Anomalies: Click the link in the email to go directly to the platform and review the anomalies.
Additional details
- You will receive anomaly detection notifications through the Daily Digest you have configured. This includes both Data alerts and Profiler anomaly information.
Additional details
- If data runs at 2:00 PM and an anomaly is detected at 2:16 PM, the alert will appear on the Task page immediately. However, if your Daily Digest is scheduled for 11:00 AM, you’ll receive the anomaly alert for that report in the next digest at 11:00 AM.
Accessing the Anomaly Detection Platform
-
Step 1: Log In: Use your credentials to log in to the platform.
-
Step 2: Access the Affected Run: Click on the direct link provided in the email notification to quickly access the specific run that has been affected.
-
Step 3: Navigate to the Dashboard: After accessing the affected run, you will be directed to the platform’s Dashboard page.
-
Step 4: Identify Anomalies: On the Dashboard page under the Data Quality section, check the Crawlers Anomalies and Data Anomalies sections. If any anomalies are detected, you will see red dotted lines in these sections, making it easy to spot the issues.
Anomaly Alerts Overview
The platform is designed to notify you whenever something unusual an anomaly is detected. These alerts are crucial for identifying and addressing issues early on. The alerts are categorized into two main types:
| Types | Description |
|---|---|
| Crawler Issues | These alerts occur when there are problems with the crawlers. Crawlers are automated tools used to collect data from external sources. If something goes wrong with the crawling process, the platform will notify you. |
| Data Issues | These alerts are triggered when the platform detects inconsistencies or missing data. This could mean incomplete records, incorrect values or data that does not match the expected patterns. |
Crawler Anomaly Detection
Crawler anomaly detection is focused on monitoring the performance and behavior of the crawlers. The system looks at the past 25 runs of the crawler to detect irregularities. The following parameters are analyzed to detect anomalies:
- Row count
- Total Request, Total Request/Rows
- Request Failed, Request Failed/Rows
- Duration, Duration/Rows
- Bandwidth Upload, Bandwidth Upload/Rows
- Bandwidth Download, Bandwidth Download/Rows
- Error count
Anomalies are detected when there are unusual changes in any of these parameters, which could signal that the crawler is not functioning optimally. These alerts help you take action before the issues affect the overall data collection process.
Data Anomaly Detection
Data anomaly detection identifies issues in the scrapped data by reviewing the last 25 runs of the system. The alerts are specific to the set data collection schedule. The system checks each column in the data for any irregularities or unexpected changes and if any issues are found, it sends an alert to notify you of potential problems. The following parameters are analyzed to detect anomalies:
- Distinct count
- Fill rate
- Size
Anomalies are detected when there are unusual changes in any of these parameters.
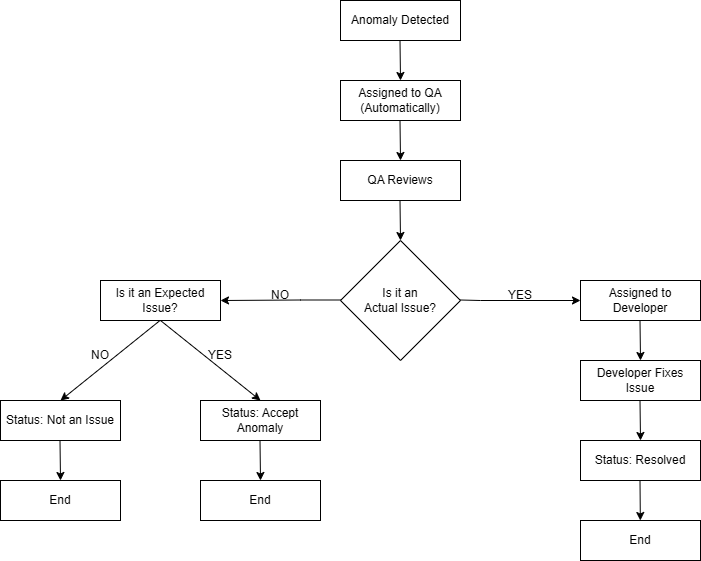
Admin Actions in the Action Section
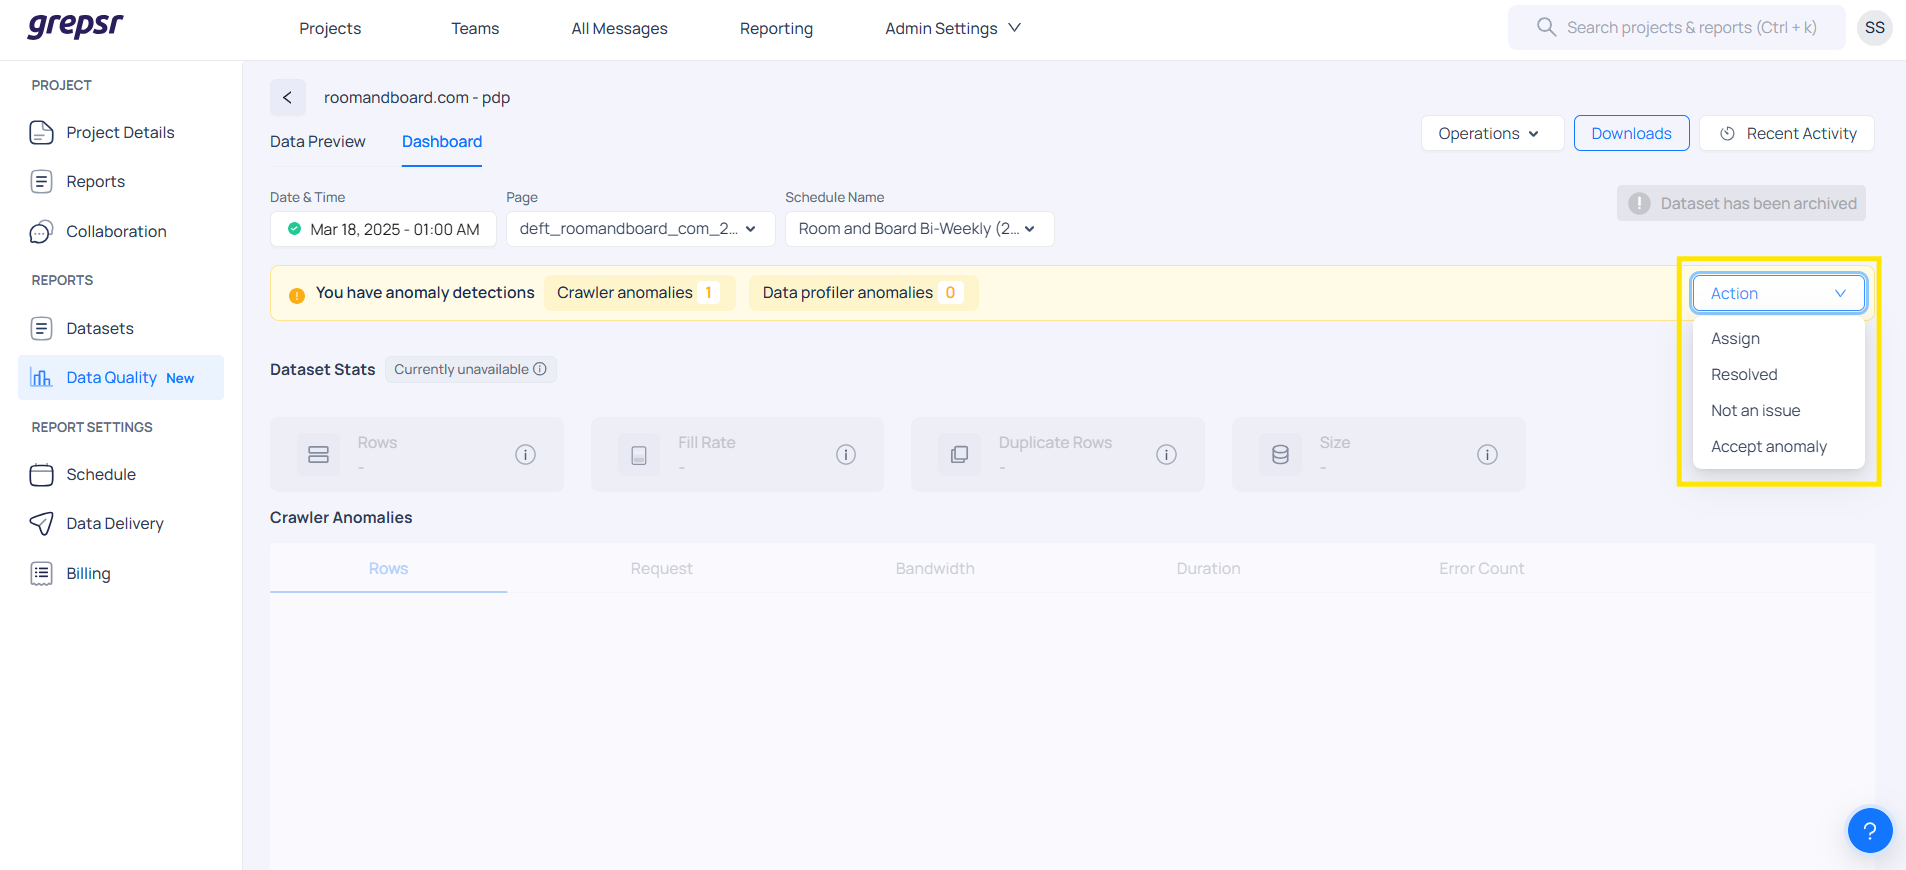
As an Admin, you have four key actions available to manage anomalies efficiently. These actions are accessible under the "Action" section of the anomaly panel:
| Actions | Description |
|---|---|
| Assign | Use this option to delegate the anomaly to the appropriate engineer. You can select the assignee from a dropdown list to ensure the right person investigates and resolves the issue. |
| Resolved | Select this action once the anomaly has been reviewed and the underlying issue has been addressed or resolved. Marking it as Resolved helps in tracking the status and maintaining accurate records. |
| Not an Issue | If the anomaly is determined to be a false positive or not a real issue, choose this option. You'll also be required to provide a reason in the text box (e.g., This is not an actual issue). Marking it as "Not an Issue" prevents similar anomalies from being flagged in the future, helping to reduce noise. |
| Accept Anomaly | This option is used when the anomaly is already known and does not require any further action. It indicates that the behavior is expected under current conditions (e.g., This is expected due to a schedule update). Accepting the anomaly acknowledges it without triggering unnecessary alerts or reviews. |
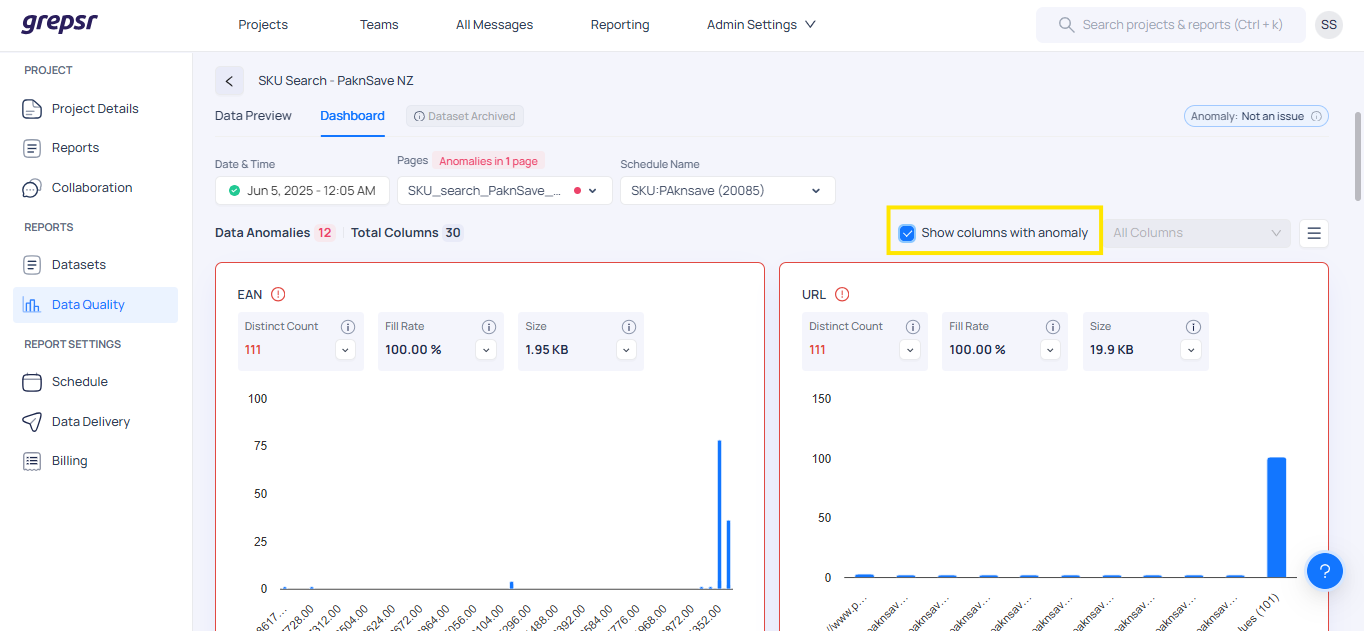
Viewing Columns with Anomalies
-
Navigate to the Dashboard page.
-
Click on the Show columns with anomaly option.
-
This filters the view to display only columns where anomalies are detected.
-
It helps you identify anomalies more quickly and efficiently for further analysis.
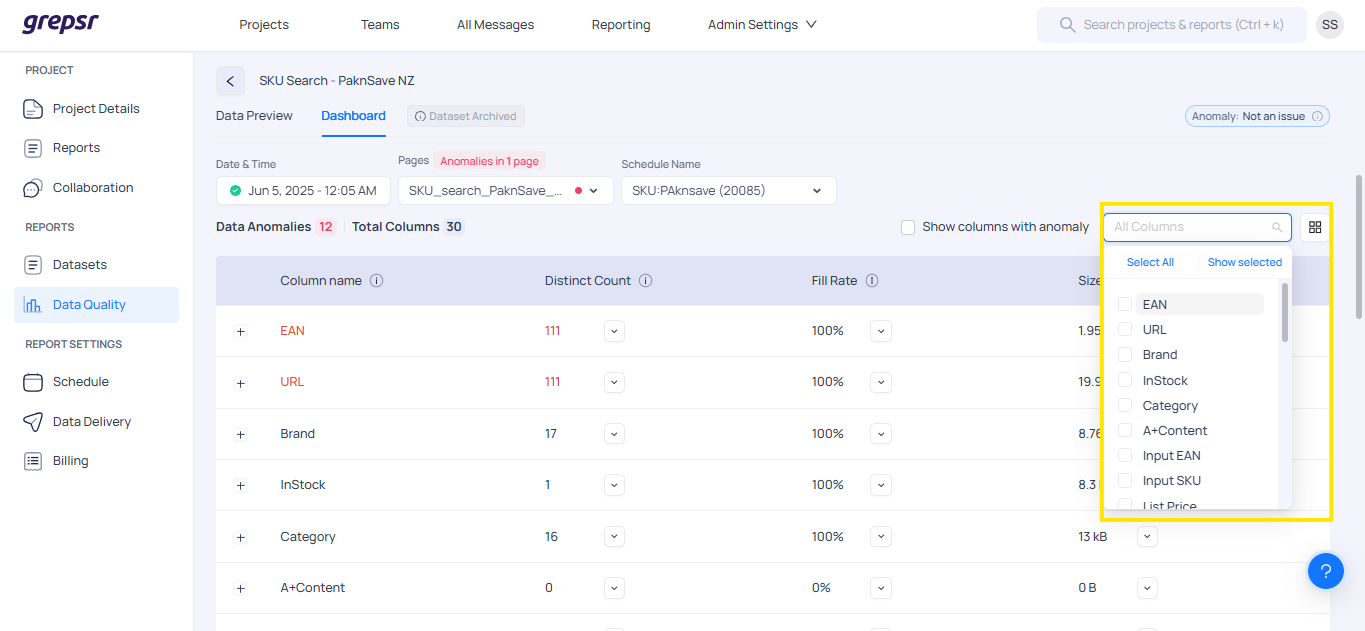
Filtering Columns and Changing Views
-
On the Dashboard page, you can filter and select specific columns to view. For that click on the filter dropdown button to choose one or multiple columns based on your focus.
-
By default, the data is displayed in Grid View.
-
To switch to List View, click the List View icon located on the middle-right side of the screen.
-
List View offers a clean, organized layout with column-level insights, including:
   * Distinct count

   * Fill rate

   * Column size

   * A distribution graph for visualizing data patterns and spread.
Handling Anomalies
-
If the anomaly is accurate:
- Fix the data issue or assign it to the developer who can fix the anomaly.
- Mark the anomaly as Fixed.
-
If the anomaly is incorrect (false positive or low-priority issue):
- Mark the anomaly as Not an anomaly.
- Adjust parameters in the report configuration to refine future detections.
Ignoring Low-Priority Anomalies
- Some anomalies might not be critical or may be false positives.
- Use the Report Configuration settings to fine-tune detection parameters and prevent unnecessary alerts.
Report configuration settings
The platform allows you to set up anomaly detection configurations for both crawler-level and data-level anomalies separately. You can use the following settings to customize how anomalies are detected:
{
    "exclude_columns": [
        "item_count"
    ],
    "exclude_ratio_columns": [],
    "consider_anomalies": {
        "item_count": {
            "condition": "exceeds",
            "basis": "average"
        },
        "request_count": {
            "condition": "falls_below",
            "basis": "average"
        }
    }
}
Key Configuration Settings:
-
Exclude Columns: This option allows you to specify which columns or parameters should be ignored during anomaly detection.
* For crawler-level anomalies, examples of parameters you might exclude include row count, bandwidth upload, bandwidth download, total requests, failed requests, error count and duration. * For data-level anomalies, you can exclude specific columns from the dataset. -
Exclude Ratio Columns: Similar to "exclude columns," this setting lets you exclude the ratio of certain columns from being considered during anomaly detection.
-
Consider Anomalies: This option helps filter out anomalies based on the values. For example, if the row count for a specific run exceeds the average, it could be flagged as an anomaly. However, this may or may not be an actual issue depending on the context. If you don’t want to receive alerts about anomalies where the row count is greater than average, you can configure the system to ignore such anomalies. This setting can be applied to any column in the report.
These configurations allow you to customize anomaly detection based on your needs, ensuring that only relevant anomalies trigger alerts.
Best Practices for Anomaly Detection
-
Monitor the Dashboard Regularly: Keep an eye on the "Anomaly Detection" dashboard to spot any issues early.
-
Address Issues Quickly: Acknowledge and address detected anomalies promptly to prevent delays in resolution.
-
Notify the Right Team: Inform the appropriate team about detected anomalies for faster resolution.
-
Track Recurring Issues: Maintain a record of recurring issues to identify patterns and implement long-term improvements.
-
Adjust Report Configurations: Fine-tune your report settings to reduce false positives and enhance detection accuracy.
Support and Escalation Procedures
For unresolved issues:
-
Contact Internal Support: Reach out to the internal support team through the Slack channel for assistance.
-
Escalate Critical Issues: If an issue is critical and unresolved, escalate it to the engineering team for urgent attention.